Thursday 28 November 2013

How Amanah Saham Bumiputera (ASB) Calculates Dividend and Bonus

Once GST is implemented in 2015, many are expecting the inflation rate for Malaysia to increase. With that in mind, many Malaysians are searching for passive investment that could generate returns that are equal or higher then the inflation rate in order preserve the value of their savings. 

One of the popular "near" guaranteed passive investment available in Malaysia is Amanah Saham Bumiputera. Amanah Saham Bumiputera or ASB in short is one of the most seek after passive investment by Malaysian Bumiputera due to its consistent dividend and bonus. See historical dividend and bonus for ASB below:

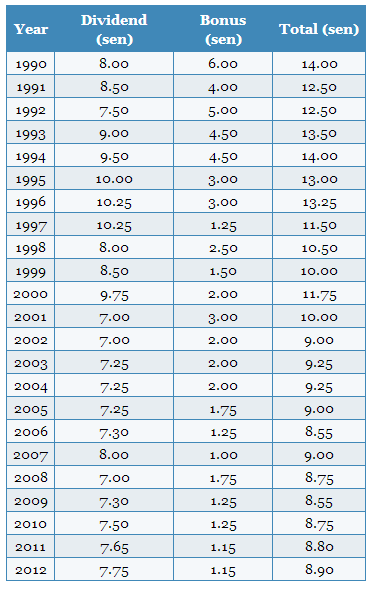
Historical Dividend courtesy of 1-Million-Dollar-Blog
Due to ASB's popularity, most financial/investing/personal finance blog including this one would have written extensively about ASB. In some of my older articles about ASB, I wrote with the perception that dividend and bonus from ASB can be summed into a single value in order to calculate the annual return.


A BIG MISTAKE Indeed! 
(Rest  assured I've made the necessary amendments to my older articles)

Now if we look at dividend and bonus from a logical point of view, the fact that ASB declares dividend and bonus separately should have raised some doubts. If both are the same, why not just declare everything as dividend only! 

This severe lack of understanding on the difference between dividend and bonus has lead many ASB investors to have the following misperceptions:
  • Annual return is calculated based on the summation of dividend + bonus
  • Dividend and bonus are calculated based on the balance in ASB account as of 31st Dec for each year
If the above are incorrect, then how exactly does ASB calculate their dividend and bonus for investors? Let's take a look...

Understanding & Calculating ASB Dividend and Bonus
ASB Dividend
Key Points About ASB Dividend:

  • ASB Dividend and ASB Bonus are calculated differently and separately from one another. 
  • Dividend is calculated on a monthly basis over the duration of the year dividend is declared. We term the monthly dividend calculation as Monthly Dividend Amount.
  • Total Dividend Paid for the year is the Sum of calculated Monthly Dividend Amount from Jan till Dec.
  • To calculate the Monthly Dividend Amount for each month, the Lowest Account Balance for each month is used.
  • Lowest Account Balance for a month is defined as the lowest value of your ASB account for that particular month. Let's see Example 1 to 3 below:
     Lowest Account Balance (Example 1): 

  • On 1st Jan 2013, your account balance in ASB is RM5000
  • You withdraw RM1000 on the 3rd of Jan 2013
  • You then Redeposit RM2000 into your ASB on the 10th of Jan 2013. 
  • What is your Lowest Account Balance for Jan 2013? 
  • Answer is RM4000.00

     Lowest Account Balance (Example 2):

  • On 1st Jan 2013, your account balance in ASB is RM5000
  • You deposit RM1000 on the 3rd of Jan 2013
  • You then withdraw RM2000 from your ASB on the 10th of Jan 2013. 
  • What is your Lowest Account Balance for Jan 2013? 
  • Answer is RM4000.00

     Lowest Account Balance (Example 3):

  • On 1st Jan 2013, your account balance in ASB is RM5000
  • You deposit RM1000 on the 3rd of Jan 2013
  • You then withdraw RM500 from your ASB on the 10th of Jan 2013. 
  • What is your Lowest Account Balance for Jan 2013? 
  • Answer is RM5000.00 

Formula for ASB Dividend Calculation:
Monthly Dividend Amount calculation:


By obtaining the Monthly Dividend Amount from Jan till Dec,

Total Dividend Paid is then calculated using this formula:


ASB Bonus
Key Points About ASB Bonus

  • Bonus is also calculated on a monthly basis which we term it as Monthly Bonus Amount.
  • The significant difference between Bonus and Dividend is that Total Bonus Paid by ASB is the Sum of Monthly Bonus Amount calculated from the number of months you've stayed invested in ASB. However this is subjected to a maximum of 120 months or 10 years from bonus declaration year. 
  • In other words, ASB Bonus is calculated based on all the months over a period of 10 years starting from the year bonus is declared. 
  • To calculate the Monthly Bonus Amount for each month, ASB also uses the Lowest Account Balance as part of the calculation.
  • Let's take a look at examples below:
     
     No. of Months eligible for Total Bonus Calculation (Sample 1)
  • You have invested into ASB since 1st Jan 2010
  • ASB Bonus of 2% is declared for 2013
  • How many months will be taken into consideration for Monthly Bonus Amount calculation?
  • Answer : 48 months (Jan 2010 till Dec 2013)
     
     No. of Months eligible for Total Bonus Calculation (Sample 2)
  • You have invested into ASB since 1 Jan 1990
  • ASB Bonus of 2% is declared for 2013
  • How many months will be taken into consideration for Monthly Bonus Amount calculation?
  • Answer : 120 months (Jan 2004 till Dec 2013)* 
*Bonus calculation will not include the months from Jan 1990 till Dec 2003 as the bonus is set to a maximum of 120 months or 10 years from the year bonus is declared.

Formula for ASB Bonus Calculation:
Monthly Bonus Amount calculation:


By obtaining the Monthly Bonus Amount over a period of 120 months from the year bonus is declared,

Total Bonus Paid is then calculated using this formula:


Sample Calculations
Case Study 1 :
Invest Lump Sum of RM50,000 starting Jan 2012
ASB declared the following for 2012:
Dividend 2012 = 7.75%
Bonus 2012 = 1.15%

What is the Total Dividend Paid, Total Bonus Paid and Actual Annual Rate of Return for 2012?

Calculation:


Observation:
As you can see, the Lowest Account Balance for Jan 2012 is RM0.00 because this investment started in Jan 2012. If you've started in Dec 2011, then the Lowest Account Balance for Jan 2012 should be RM50,000.

Despite Dividend declared is 7.75% and Bonus at 1.15%, which many tend to sum up as 8.90%, we see that the Actual ASB Annual Rate of Return for 2012 is only 7.21%.

Case Study 2 :
Invest Lump Sum of RM50,000 starting Jan 2011
ASB declared the following for 2011:
Dividend 2011 = 7.65%
Bonus 2011 = 1.15%

ASB declared the following for 2012:
Dividend 2012 = 7.75%
Bonus 2012 = 1.15%

What is the Total Dividend Paid, Total Bonus Paid and Actual Annual Rate of Return for 2011?
What is the Total Dividend Paid, Total Bonus Paid and Actual Annual Rate of Return for 2012?

Calculation for 2011:


Calculation for 2012:


Case Study 3 :
Invest RM500 monthly starting Jan 2012
ASB declared the following for 2012:
Dividend 2012 = 7.75%
Bonus 2012 = 1.15%

What is the Total Dividend Paid, Total Bonus Paid and Actual Annual Rate of Return for 2012?

Calculation:


Summary
Finding out how ASB calculates Dividend and Bonus has been a real eye opener for me. This changes my perception on ASB and hopefully assist others to make better decisions when it comes to investing into ASB. A clear cut example for ASB investors is maximized the Dividend and Bonus for ASB through Lump Sum investing instead of monthly. In addition, knowing how the calculation works helps you to chart your financial goals more accurately.

With that I bid all of you Cheers and Happy Investing!


If you like reading this post, it would do me a great favor by:
1. Sharing this post on your Facebook!
2. Liking my Facebook Page


You can also contact me at shanesee03@gmail.com on how to start your own long term passive investment.

Sunday 17 November 2013

OCBC - MaxEdu Choice Plan (Finding out the % Return)

Most recently, I realized that there's a growing trend of Malaysian who are planning or have already invested into an insurance savings plan / child education savings plan. Such a plan also commonly known as annuities scheme requires the participant to pay a certain amount of cash for a fixed period of time. After which that participant will receive periodic payments over an extended period of time, followed by a lump sum payment return upon maturity of the plan.   

In this post, I will be looking at a child education savings plan by OCBC Bank called MaxEdu Choice. 

Key Characteristics of MaxEdu Choice
1. Pay only 5 years of Premium
2. Receive or accumulate cash payouts in the policy year when your child turns 17.
3. Policy matures in the policy year when your child turns 21
4. Includes insurance cover for death, terminal illness, or total and permanent disability for your child

How does MaxEdu Choice work?
Sample scenario as provided by this plan:

OCBC MaxEdu Choice - Click to Enlarge
How much Mr. Tan has to pay for this plan?
Premium : RM6,712.20 per year (RM559.35 per month)
Total years of premium payment : 5 years
Total premium paid after 5 years : RM33,561


What will Mr. Tan will obtain in return:
  • Insurance cover of RM30,000 for death, total and permanent disability (TPD) and terminal illness coverage for his son, Brandon till the age of 21. (please correct me if I am wrong)
  • Two payouts when Brandon turns 17 and 18. Amount paid is equivalent to 5% of the sum insured. That would be RM1,500 per year.
  • Another two payouts when Brandon turns 19 and 20. Amount paid is equivalent to 30% of the sum insured. That would be RM9,000 per year.
  • When Brandon turns 21, the policy matures and Mr. Tan will receive a guaranteed amount equivalent to 30% of the sum assured (RM9,000) and a non-guaranteed amount of RM18,016. This would total up to RM27,016 received by Mr. Tan upon maturity.
The diagram below illustrates how the payout of the policy looks like:

Click to Enlarge
What is the percentage (%) annual returns of MaxEdu plan?
The returns of this plan is not a straightforward calculation due to the following reasons:
  1. When Mr. Tan contributed a total of RM33,561 over 5 years, there was no annual interest earned.
  2. From the 6th to the 10th year of this plan (another 5 years), the RM33,561 placed by Mr. Tan also earned zero annual interest.
  3. Only from the 11th year onwards will Mr. Tan earn 5% of the sum assured (2 years), 30% of the assured (another 2 years) and finally receive a lump sum cash payment upon maturity. 
Therefore to determine the percentage (%) annual returns of this plan, we have to calculate the returns using the Internal Rate of Return (IRR) formula.

Internal Rate of Return based on MaxEdu Guaranteed Returns only:
Amount Invested : RM33,561
Guaranteed Returns : (RM1500 x 2) + (RM9000 x 2) + RM9000 = RM30,000
Internal Rate of Return : 

Internal Rate of Return based on MaxEdu Guaranteed + Non Guaranteed Returns:
Amont Invested : RM33,561
Total Returns : (RM1500 x 2) + (RM9000 x 2) + RM27,016 = RM48,016
Internal Rate of Return :


Summary:
Through identifying the IRR of this plan, you can now determine the worthiness of investing in this plan. 
Is there a need to have insurance protection for your kid? Perhaps saving up and getting the best returns for you child education fund is the main priority?  Could there be better investment plans around? 

Cheers and Happy Planning!

P.s : I just realized that OCBC MaxEdu plan is only available at Singapore! Never the less, by finding out what's on offer from our closest neighbor, I realize that the insurance savings plan offered in Malaysia is so much better then Singapore in terms of IRR.  .

Related Post:

If you like reading this post, it would do me a great favor by:
1. Sharing this post on your Facebook!
2. Liking my Facebook Page


You can also contact me at shanesee03@gmail.com on how to kickstart a child's education fund with the right plan and investment strategy.

Tuesday 12 November 2013

Top 10 Best Performing Unit Trust Funds As of 8th November 2013

If this is your first time reading this review, I would highly recommend that you read "A Guide Towards Understanding Unit Trust Performance Table"before proceeding.

Review
Fund Category : Equity Malaysia
Top 10 Best Performing Fund for Category Equity Malaysia (click Image to Enlarge):

Top 10 Best Performing Unit Trust Fund (Equity Malaysia)
5 Years Annualised Ranked 1 (Equity) - Phillip Master Equity Growth Fund 

5 Years Annualised Ranked 1 (Islamic Equity) - MAAKL-HDBS Flexi Fund 

4 Weeks Gain/Loss Ranking Table for Category Equity Malaysia Funds:

Fund Name
YTD as of
9th Oct 2013
YTD as of
8th Nov 2013
4 Weeks
Gain / Loss (%)
4 Weeks Gain/
Loss Rankings
Previous
4 Weeks Gain/Loss Rankings
Phillip Master Equity Growth Fund
27.64
32.1
4.46
1
1
Kenanga Growth Fund
16.21
18.98
2.77
3
7
CIMB-Principal Wholesale Equity Fund
16.05
20.5
4.45
2
5
MAAKL-HDBS Flexi Fund
13.27
15.13
1.86
5
4
CIMB-Principal Equity Fund
16.25
18.52
2.27
4
2
Kenanga Syariah Growth Fund
15.99
17.7
1.71
6
6
Hwang AIIMAN Growth
17.63
20.4
2.77
3
3
Public Focus Select Fund
Newcomer
7.91
N/A
N/A
N/A
Public Islamic Opportunities Fund
Newcomer
24.58
N/A
N/A
N/A
Public Regular Savings Fund
Newcomer
12.78
N/A
N/A
N/A
AVERAGE 4 WEEKS GAIN/LOSS (%)
2.90
Top Performing Fund over 4 weeks period: 
Phillip Master Equity Growth Fund (+4.46%)

Worst Performing Fund 4 weeks period:
Kenanga Syariah Growth Fund (+1.71%)

Newcomers:
Public Focus Select Fund
Public Islamic Opportunities Fund
Public Regular Savings Fund

Performance Comparison with the KLSE Index between 10 Oct 2013 to 8 Nov 2013


KLSE Index (%) Gain/Loss : +1.61%
Average Top 10 Unit Trust Equity (%) Gain/Loss : +2.90% (Out performed the KLSE Index)

Summary
Despite many investors anticipating a big drop for the KLSE after Budget 2014 (myself included), our Prime Minister managed to roll out a rather fair budget allocation that kept the sentiment positive for investors. Sectors benefiting from Budget 2014 such as Telecommunication, Energy and Plantation kept the local Bursa stable and above the 1800 points level.

The announcement of Budget 2014 also created opportunities for fund managers to cherry pick companies from these key sectors. Once again the Average Top 10 Unit Trust Equity (%) gains of +2.90% outperformed that of the  KLSE Index (+1.61%) over the same period.

In terms of individual unit trust fund performance, once again Phillip Master Equity Growth Fund (PMEGF) is the star performer by adding +4.40% to its Yield To Date (YTD). This marks the 2nd consecutive time that PMEGF retains the spot of top performing fund over a 4 week period. Despite being the lesser known fund, PMEGF, as I have mentioned as far back as my April 2013 review will be the fund to watch in terms of performance.

Review
Fund Category : Asia excluding Japan
Top 10 Best Performing Fund for Category Asia Exc Japan (click Image to Enlarge):


5 Years Annualised Ranked 1 (Equity) - Public Regional Sector Fund

5 Years Annualised Ranked 1 (Islamic Equity) - Public Islamic Asia Dividend Fund 

4 Weeks Gain/Loss Ranking Table for Category Asia Exc Japan Funds:


Fund Name
YTD as of
9th Oct 2013
YTD as of
8th Nov 2013
4 Weeks
Gain / Loss (%)
4 Weeks Gain/
Loss Rankings
Previous
4 Weeks Gain/Loss Rankings
Public Islamic Asia Dividend Fund
3.15
3.76
0.61
3
3
Pheim Asia Ex-Japan Islamic
13.47
14.35
0.88
2
1
Public Asia Ittikal Fund
1.88
2.12
0.24
7
5
Public Regional Sector Fund
15.26
15.36
0.1
9
7
PB Islamic Asia Equity Fund
1.46
1.91
0.45
5
4
Eastspring Investments Asia Pacific Shariah Equity Fund
-0.25
-0.07
0.18
8
6
Pheim Asia Ex-Japan
2.67
3.22
0.55
4
N/A
CIMB Islamic Asia Pacific Equity Fund
3.15
4.56
1.41
1
8
MAAKL Pacific Fund
4.21
4.59
0.38
6
2
Public Far-East Select Fund
9.36
8.67
-0.69
10
N/A
AVERAGE 4 WEEKS GAIN/LOSS (%)
0.41

Top Performing Fund over 4 weeks period: 
CIMB Islamic Asia Pacific Equity Fund (+1.41%)

Worst Performing Fund over 4 weeks period:
Public Far-East Select Fund (-0.69%)

Newcomers:
-None-

Performance Comparison with the MSCI Asia Excluding Japan Index between 10 Oct 2013 to 8 Nov 2013


MSCI Asia Exc Japan Index (%) Gain/Loss : -0.55%
Average Top 10 Unit Trust (%) Gain.Loss : +0.41% (Out performed the MSCI Index)

Summary
The MSCI Asia Excluding Japan Index had a rough 4 weeks as seen from the chart above. Gains and losses interchanged over the 4 week period from Oct 10th, 2013 to Nov 8th, 2013. The index dip on news that US Feds might start tapering of their stimulus program earlier then expected only to see recovery from positive economic data coming from China. A mixture of negative US tapering news and positive China economic data has created much volatility to the MSCI Asia Exc Japan index.

China and South Korea outperformed, while India and Indonesia lagged. Chinese equities advanced on the hope that the economy had bottomed, while South Korea recovered from tensions with the North that had impacted in the second quarter. Unit Trust Funds that have considerable allocation into Philippines stocks should see lesser gains as the aftermath of Typhoon Haiyan shaved 1.4% of the Philippines stock market today (11th Nov 2013). 

Despite the MSCI index volatility, top performing fund over the 4 weeks period, CIMB Islamic Asia Pacific Equity Fund (CIAPEF) managed to gain +1.41%. Another fund worth considering is Pheim Asia Ex-Japan Islamic Fund (PAEJIF) which is known for its consistency in generating returns.

Review
Fund Category : Greater China
Top 10 Best Performing Fund for Category Greater China (click Image to Enlarge):


5 Years Annualised Ranked 1 (Equity) - CIMB-Principal Greater China Equity Fund

5 Years Annualised Ranked 1 (Islamic Equity) - Public China Ittikal Fund 

4 Weeks Gain/Loss Ranking Table for Category Greater China Funds:

Fund Name
YTD as of
9th Oct 2013
YTD as of
8th Nov 2013
4 Weeks
Gain / Loss (%)
4 Weeks Gain/
Loss Rankings
Previous
4 Weeks Gain/Loss Rankings
CIMB-Principal Greater China Equity Fund
7.73
7.02
-0.71
4
2
PB China Pacific Equity Fund
9.3
8.26
-1.04
7
6
Public China Ittikal Fund
6.57
6.18
-0.39
1
5
Public China Select Fund
10.08
9.12
-0.96
5
4
PB China Titans Fund
4.53
3.88
-0.65
3
8
MAAKL Greater China Fund
2.54
1.55
-0.99
6
7
AmIslamic Greater China
-2.67
-3.31
-0.64
2
3
Eastspring Investments Dinasti Equity Fund
5.69
3.8
-1.89
8
9
Hwang China Select Fund
17.91
15.43
-2.48
9
1
Manulife Investment - China Value Fund
Newcomer
7.61
N/A
N/A
N/A
AVERAGE 4 WEEKS GAIN/LOSS (%)
-1.08

Top Performing Fund over 4 weeks period: 
Public China Ittikal Fund (-0.39%)

Worst Performing Fund over 4 weeks period:
Hwang China Select Fund (-2.48%)

Newcomers:
Manulife Investment - China Value Fund

Performance Comparison with the Shanghai Stock Exchange (SSE) Index between 
10 Oct 2013 to 8 Nov 2013


SSE Index (%) Gain/Loss : -3.87%
Average Top 10 Unit Trust Equity (%) Gain.Loss : -1.08% (Out performed the SSE Index)

Summary
Historical "Average 4 Weeks Gain/Loss (%)" for Greater China funds over the past 4 months are as shown below:
  • 10th July - 4th August : +6.22%
  • 7th August - 13th Sept : +5.41%
  • 13th Sept - 9th Oct : -0.93%
  • 9th Oct - 8th Nov : -1.08%
Despite two consecutive losses over the past 8 weeks, the Top 10 Funds in this category managed to outperformed (in terms of minimizing losses) the Shanghai Stock Exchange Index. 

In terms of economic outlook, I am rather optimistic about the long term recovery of China's economy based on the following reasons:

1. Industrial output rose a more-than-estimated 10.3 percent from a year earlier in October and manufacturing investment strengthened.

2. Customs data showed overseas sales rebounded by more than forecast.

3. President Xi Jinping and top Communist leaders conclude a four-day gathering to map out an economic blueprint to sustain growth and drive the urbanization of hundreds of millions of rural residents.

4. Standard Chartered last month raised its estimate for China’s 2013 economic growth to 7.6 percent from 7.5 percent and revised next year’s forecast to 7.4 percent from 7.2 percent. 

With the recent uncertainty of when the US Fed will start tapering their stimulus program (which resulted in the see-saw effects on the Asia Exc Japan Funds), I believe investors should consider China based funds as an alternate investment option. In addition, the recent minor losses of China based Funds has created an opportunity for investors to buy in a lower unit price. 

That's all for this review folks!

Cheers and Happy Investing!

P/s : The announcement of Goods and Services Tax (GST) has been fiercely criticize by many especially over Facebook. Once it is implemented in 2015, prices of goods and services are bound to rise, leading to higher inflation rate. 

Instead of complaining and voicing out to deaf ears about your displeasure over GST, why not channel your energy into preparing for a better future through proper financial planning and starting your own investment plan to keep up with the inflation rate? Saving up money is one thing but not letting your money work harder for you is pure ignorance.


P.p/s : Want to invest in Top Performing Funds such as Phillip Master Equity or CIMB-Principal Greater China? Feel free to contact me at shanesee03@gmail.com for a proper advisory and recommendation.

If you like reading this post, it would do me a great favor by:
1. Sharing this post on your Facebook!
2. Liking my Facebook Page